
thought leadership
A measure-level view of Medicare Advantage and fee-for-service quality performance
By Eric Levine, Nadia Mercado | October 29, 2026
Matched comparisons show that quality differences between MA and FFS vary by measure and MA Star Rating, highlighting the limits of broad comparisons.


Comparing quality performance across Medicare populations
Differences in quality performance between Medicare Advantage (MA) and fee-for-service (FFS) Medicare are driven by both variation in care delivery, as well as the populations served. Age, clinical risk, demographic characteristics, and socioeconomic factors may all influence measured performance and can make direct comparisons between MA and FFS difficult to interpret.
Avalere Health analyzed select claims-based quality measures among beneficiaries in both programs, and used propensity score matching to create more comparable populations. The analysis separately:
- Beneficiaries enrolled in MA contracts with 2 or 2.5 Stars
- Beneficiaries enrolled in MA contracts with 4 Stars
- Matched FFS populations
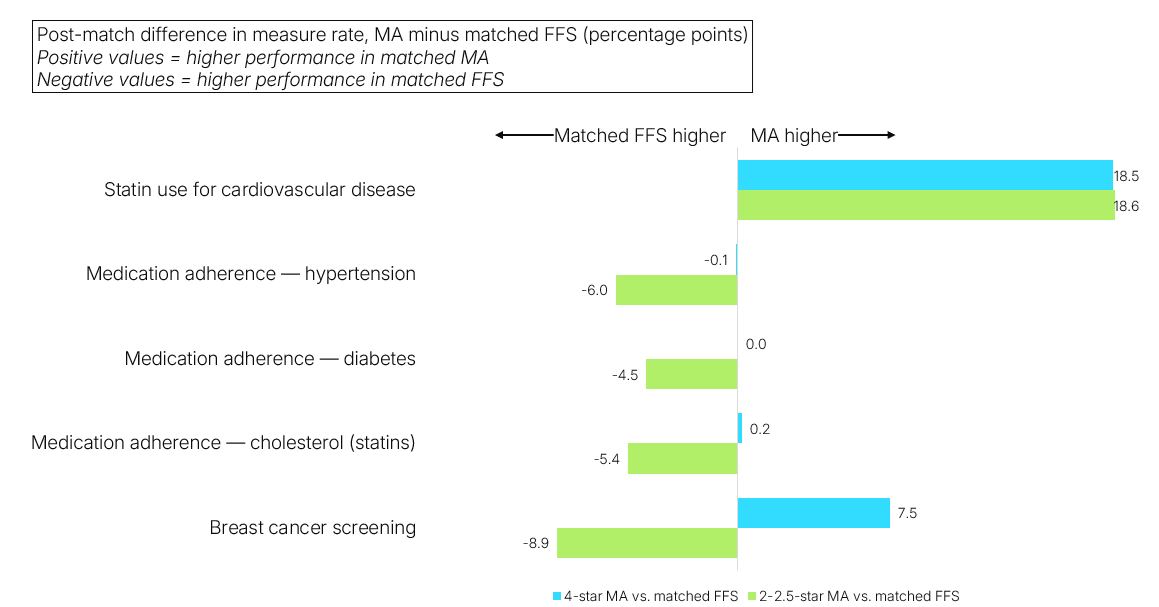
The results demonstrate that overall performance is not consistent across MA plans, nor is it consistent across individual measures between MA and FFS (see Figure 1). This illustrates why comparisons at the program level can obscure meaningful variation within MA.
Figure 1. Difference in quality measure performance between MA and matched FFS beneficiaries
Performance varied by measure and MA Star Rating
There was notable variation in quality measures between beneficiaries in 4-Star MA contracts and those in matched FFS plans:
- Medication adherence: Among beneficiaries in 4-Star MA contracts, performance was nearly identical to matched FFS plans across three medication adherence measures. Rates for adherence to cholesterol, diabetes, and hypertension medications differed by less than 0.2 percentage points between the two populations.
- Breast cancer screening: The breast cancer screening rate was 67.4% among beneficiaries in 4-Star MA contracts compared with 59.9% in the matched FFS population, a difference of approximately 7.5 percentage points based on the reported rates.
- Statin use: Statin use among patients with cardiovascular disease was 78.5% in 4-Star MA compared with 60.0% in matched FFS.
A different pattern emerged when beneficiaries in 2- and 2.5-Star MA contracts were compared with a separately matched FFS population. Low-Star MA performance was lower than matched FFS for breast cancer screening and each of the three medication-adherence measures. The differences ranged from approximately 4.5 percentage points for diabetes medication adherence to 8.9 percentage points for breast cancer screening.
Statin use for patients with cardiovascular disease was an exception. Rates were high in both the lower- and higher-rated MA groups and substantially higher than in their respective matched FFS populations. Low-Star MA contracts had a rate of 80.0%, compared with 61.4% among the matched FFS population. Although the MA populations were not directly matched to one another, the consistency across both comparisons suggests that the relationship between MA and FFS performance may differ meaningfully by measure rather than reflecting a uniform advantage or disadvantage by coverage type.
Because the analysis was observational, it was not designed to determine why these measure-level differences occurred.
Matching contextualizes MA–FFS comparisons
Before matching, the MA and FFS populations differed across several observable characteristics, including demographic composition and clinical risk. Avalere Health used propensity score matching based on age, sex, race and ethnicity, Charlson Comorbidity Index score, median household income in the beneficiary’s ZIP Code, and Hierarchical Condition Category risk score to reduce differences between the comparison groups.
The persistence of several measure-level differences after matching suggests that observable differences in beneficiary characteristics alone do not explain all the variation in measured performance. However, the analysis is observational and does not establish that enrollment in MA or FFS caused the differences observed. Matching can account only for characteristics included in the analysis, and other differences in beneficiaries, providers, markets, benefit design, or care delivery may contribute to performance.
Each MA population was also matched separately to FFS beneficiaries. The resulting FFS comparison populations should therefore be interpreted as benchmarks for their respective MA cohorts rather than as a single common comparison group.
Opportunities for further research
Pairing Consumer Assessment of Healthcare Providers and Systems (CAHPS) data with propensity score-matched claims analyses could add the beneficiary perspective to assessments of Medicare quality. Avalere Health has access to MA and Medicare CAHPS data from 2018 to 2025 through a research-focused data use agreement with CMS for use in the Chronic Conditions Warehouse Virtual Research Data Center (VRDC). Where claims data can identify whether selected services and medication use were observed, CAHPS data can help assess how beneficiaries experienced access, communication, care coordination, and overall care. A follow-on analysis could examine, for example, whether enrollees in lower-rated MA contracts also report greater challenges accessing routine or specialty care, or whether enrollees in higher-rated contracts report better care coordination.
Implications for Medicare stakeholders
For health plans and providers, the findings support a measure-level and beneficiary-level approach to performance improvement. Similar performance on some measures can coexist with substantial differences on others, reinforcing the importance of identifying specific gaps in preventive care, medication management, and other clinical workflows rather than relying only on broad comparisons of MA and FFS performance.
For policymakers and researchers, the analysis highlights two considerations for evaluating Medicare quality. First, differences in selected enrollee characteristics should be addressed when comparing MA and FFS populations. Second, MA should not necessarily be treated as a homogeneous group. The observed patterns differed across lower- and higher-rated MA populations for several of the measures examined, although those MA populations were not directly matched to one another.
Taken together, these findings suggest that comparisons between MA and FFS are most informative when they account for beneficiary characteristics, variation within MA, and the specific quality measure being evaluated.
Methodology
Avalere used CMS Medicare enrollment and medical claims and encounters accessed through the Chronic Conditions Warehouse Virtual Research Data Center. The study identified MA enrollees in contracts with 2022 Star Ratings and required continuous enrollment during 2021 and 2022. Five selected claims-based quality measures were evaluated.
Propensity score matching was used to compare enrollees in 2- and 2.5-Star MA contracts with an FFS comparison population and, separately, enrollees in 4-Star MA contracts with an FFS comparison population. Matching incorporated age, sex, race and ethnicity, Charlson Comorbidity Index score, ZIP Code-level median household income, and HCC risk score. The analysis included an adjustment to MA HCC risk scores to account for coding-intensity differences.
Results are descriptive and should not be interpreted as estimates of the causal effect of MA enrollment on quality performance.
Analyses in this publication were conducted using Medicare data from 2022 through an agreement with CMS, wherein Avalere has access to CMS’s Chronic Condition Warehouse VRDC Data.