
thought leadership
FFS vs. MA utilization will impact relative net prices in negotiation
By Brooke Fruman, Annie Song, Arka Ghosh, Kate Davidson | October 30, 2026
Relative utilization of therapeutic alternatives in FFS vs. MA has implications for the proportion of 30-day equivalent supplies that are used as calculation weights for the negotiation Ceiling Price and Starting Point.
Written by:

Associate Principal



Background
Starting in Initial Price Applicability Year (IPAY) 2028, the Centers for Medicare and Medicaid Services (CMS) can select both Part B and Part D products for the Medicare Drug Price Negotiation Program, based on overall Medicare spend.
Once a Part B product is selected for the negotiation process, CMS will leverage Part B FFS claims and MA encounter data to calculate the ceiling price for these products. These same datasets will also be used to identify utilization and 30-day cost for therapeutic alternative products calculated as part of establishing a Starting Point benchmark in the negotiation process.
Avalere Health replicated CMS’s approach to calculating 30-day equivalent supplies (30DES) across Medicare Part B claims and MA encounter data to identify the proportion of 30DES in FFS vs. MA in a subset of products with immunology indications. Data from 2023 provides a baseline comparison of utilization by payer type to examine potential differences between FFS and MA enrollees. Further, Avalere Health examined the average number of ASP billing units per 30DES by product and indication to identify the intensity of use for each product and payer in the context of the negotiation program. These data provide a baseline for assumptions regarding the anticipated utilization mix and relative price impact of FFS vs. MA volume on the starting point and ceiling price for Part B drugs in the negotiation process. The volume differences between FFS and MA also provide insights into the potential size of the impact of negotiated Maximum Fair Prices (MFPs) on enrollees in FFS vs. MA.
Findings
- Four products generally had similar utilization by benefit across indications; however, MA volume represented the majority of use for only one therapy (Figure 1).
- Utilization by payer varied indication. The observed pattern differed for immunology products, demonstrating that indication-level insights are critical to accurate forecasting (Figure 1).
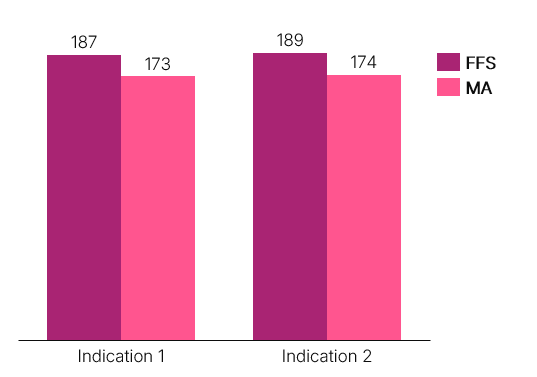
- For Product 3, MA units per 30DES was less than Part B FFS (Figure 2).
Figure 1. Overview of 30DES in Part B FFS vs. MA for four products with immunology indications, 2023
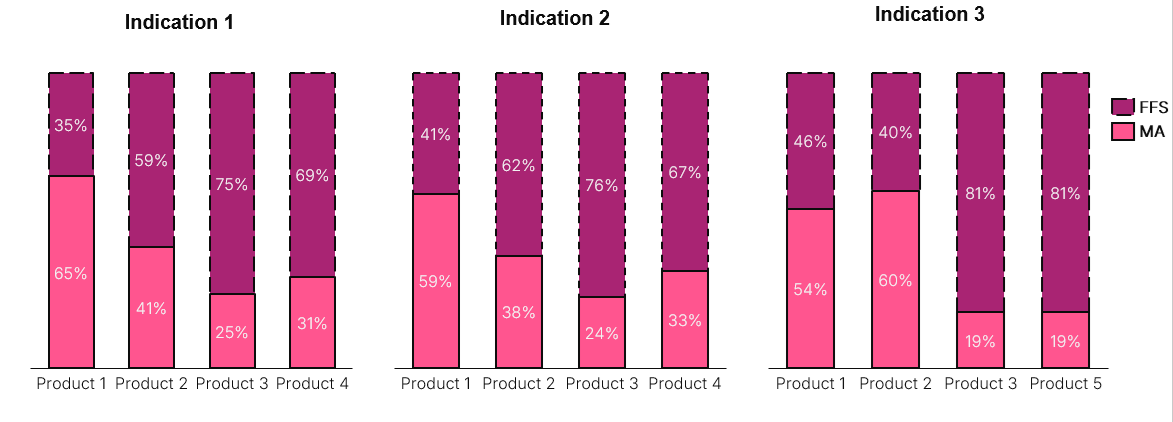
Figure 2. ASP billing units per 30DES in Part B FFS vs. MA for Product 3 (gastroenterology), 2023
Interested in learning more? Connect with us to understand how Avalere Health supports clients through the entire IRA negotiation process from preparation through effectuation.
Methodology
Avalere Health used 2023 Medicare data through an agreement with CMS, wherein Avalere Health has access to data from CMS’ Chronic Conditions Warehouse Virtual Research Data Center, including:
- 100% Medicare FFS Part B claims
- 100% Part D prescription drug event data
- 100% Medicare Advantage encounter data
Disclaimer
The analysis relies on Medicare data sourced from CMS’s Virtual Research Data Center (VRDC Data). Avalere Health relies upon the accuracy, and completeness of the VRDC Data without inquiry and makes no assurances or warranties in relation to the accuracy or completeness of the VRDC Data. CMS retains ownership of the use of VRDC Data, and the use of such data is subject to the terms of Avalere Health’s agreement with CMS and CMS rules.
Michael Ciarametaro also contributed to this article.